# Network Transform benchmarks
Tests were conducted using NetLimiter as a neutral third-party tool to monitor bandwidth usage (both download and upload). The Unity Editors were verified at **0 KB/s** before starting any test.
Tests are setup with 1 editor as a server and 1 editor as a client (made with ParrelSync). The stats shown are data accumulative for both Unity Editors.
All tests were performed in the exact same project.
**Tests carried out with the following setup**\
\&#xNAN;**-** Exact same [MonoBehaviour script](https://gist.github.com/BobsiUnity/9e7379e7f6018ed10b32fa9460d0fe0e) used to move, rotate and scale objects\
\- Network Systems own network transform added to all objects\
\- Default Network Transform settings on all objects
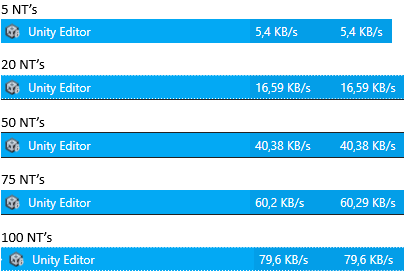
All the tests include 100 NT’s in the scene. The only thing that is modified between tests is how many of them actually move (toggled [monobehaviour script](https://gist.github.com/BobsiUnity/9e7379e7f6018ed10b32fa9460d0fe0e)). This is to test different scenarios where there are also inactive Network Transforms. Moving NTs are constantly rotating, scaling & positioning.
### Notable Adjustments:
**FishNet:** NTs were not spawning on the client until the **SceneCondition** observer check was removed from the **Network Manager**. This likely has no performance impact, but it hasn’t been confirmed.
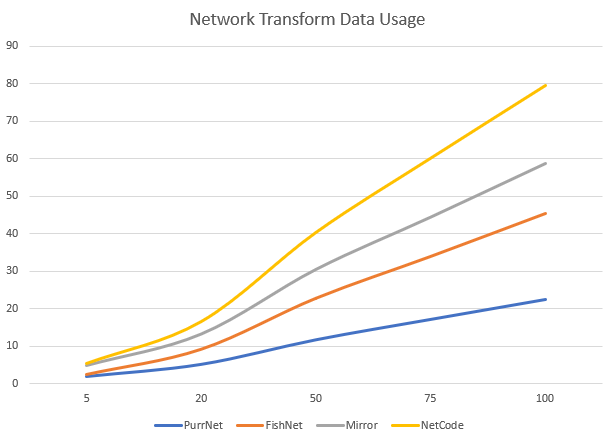
## Results & Conclusion
* PurrNet vs. FishNet → 49.00% lower usage
* PurrNet vs. Mirror → 61.43% lower usage
* PurrNet vs. NetCode → 72.56% lower usage
* FishNet vs. Mirror → 24.83% lower usage
* FishNet vs. NetCode → 46.38% lower usage
* Mirror vs. NetCode → 24.96% lower usage
## Average Usage
This is the average across all 5 tests. See the [Raw results](#raw-results-1) for data of the individual data points.
| System | Download | Upload |
| ----------------------- | ----------- | ----------- |
| PurrNet | 11.598 KB/s | 11.598 KB/s |
| Mirror | 30,356 KB/s | 30,356 KB/s |
| FishNet | 22,676 KB/s | 22,676 KB/s |
| NetCode For GameObjects | 40.434 KB/s | 40.434 KB/s |
## Why a Network Transform test?
The Network Transform is one of the most common components used with any networking solution. So if this is widely used across your project, knowing the performance of the Network Transform could be very important!
Keep in mind that specific components can hold different functionality across different systems, and it can range widely how they are handled behind the scenes. This means that the [RPC benchmarks](https://purrnet.gitbook.io/docs/readme/performance/performance) is likely a better indicator for the overall performance of the networking solution.
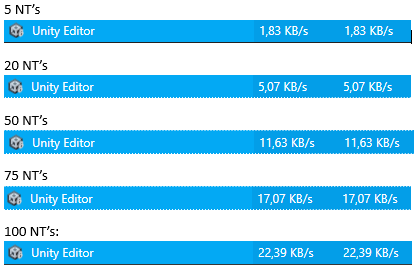
## Raw results
Keep in mind that every data-point was fluctuating with \~0.2 KB/s. The picture was taken when seen around the mid-point of fluctuation, but this leaves margin for small inaccuracy in comparison.
Download and Upload speed is the same, because both editors are represented. The server & the client. These numbers would differ if there was some faulty overhead on either side.
### PurrNet 1.8.1
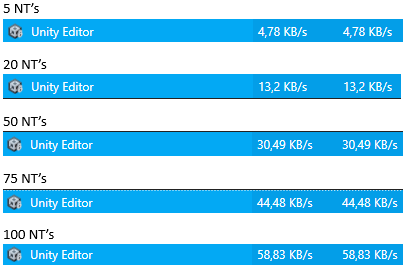
### Mirror 93.0.1 (Unreliable NT)
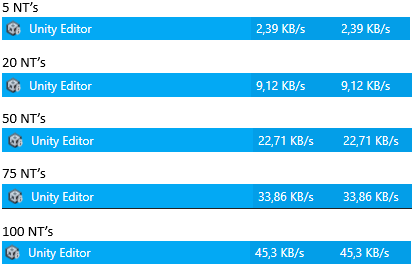
### FishNet 4.5.6R Pro
### NetCode for GameObjects 2.2.0